Artificial Intelligence
1682 Conference: The PB&J Principle

Introduction
On October 7, I attended the 1682 Conference in Philadelphia and got to hear many great speakers talk about how AI is changing customer experience. One talk that stuck with me was “The PB&J Principle: What every growing AI engine needs” by Mike Pitone from Wawa .
If you live anywhere near Philadelphia, you probably have a few Wawa memories. Maybe it’s coffee on the way to work, a late-night stop with friends, or grabbing hoagies before heading down the shore. After enough visits, you have an order you barely have to think about. Mine is the Meatball Parmesan hoagie.
What you might not know is how complicated a convenience store gets when orders come in from the counter, the kiosks, and digital channels, and all of them end up in the same kitchen.
Mike has worked in e-commerce since the early 2000s and joined Wawa seven years ago for its digital transformation. His team has been mapping that complexity since 2022, and a few months before the talk, they started a project to see whether AI could help them make sense of it. He was upfront that this was still in progress when he spoke, so this isn’t a story with a happy ending… yet!
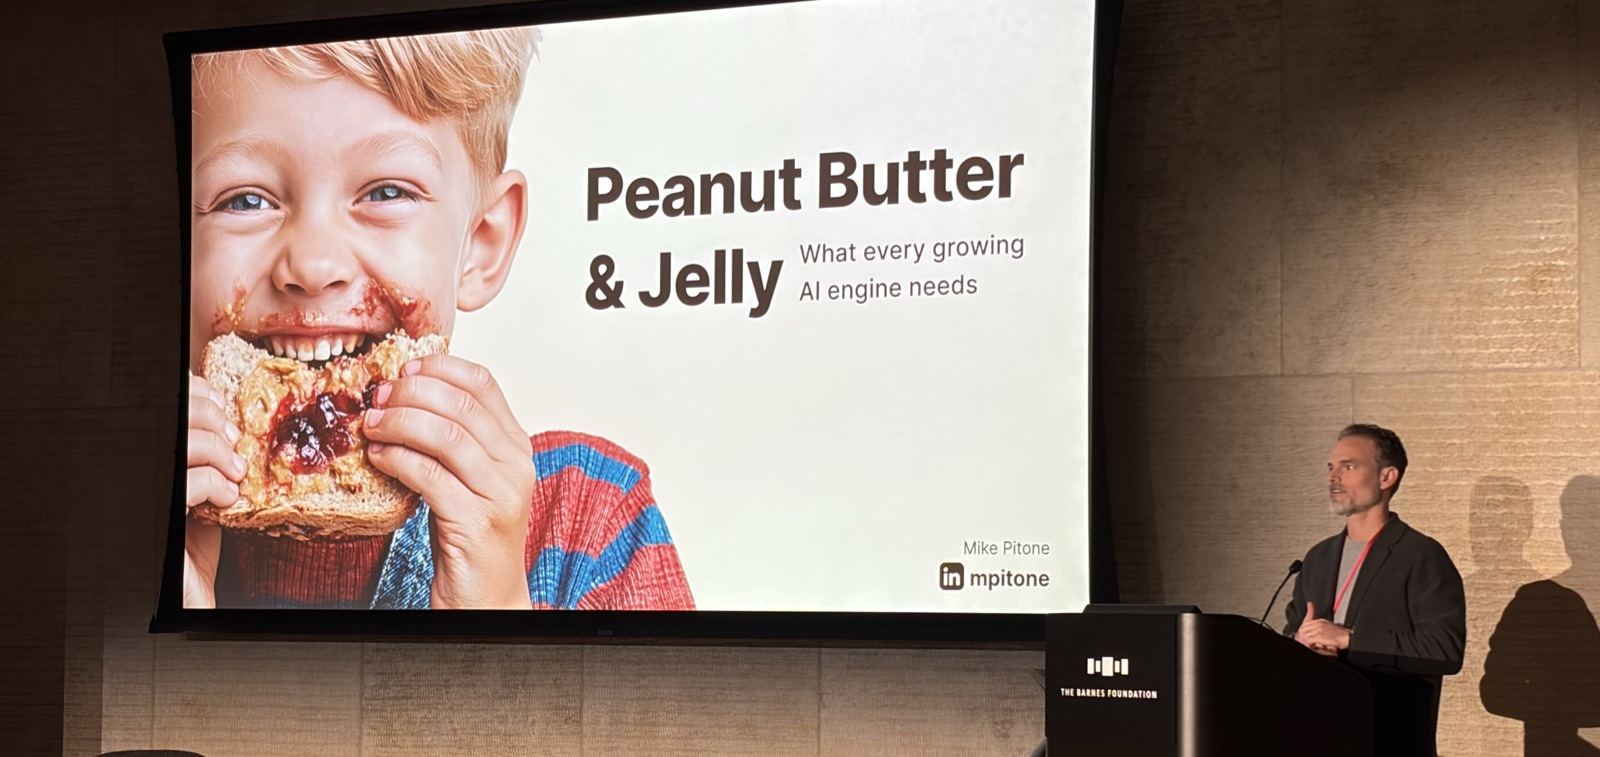
In this article, I’ll share how Wawa’s customer experience team turned a service blueprint into structured data for AI, and why the most useful lesson had nothing to do with prompt design.
A Service Blueprint with 550 Friction Points
Mike opened with a problem anyone who has done customer research will recognize: by the time you finish a journey map or a segmentation study, it’s already outdated.
He invoked the old expression about painting the Forth Bridge in Scotland: by the time you finish the job, you have to start all over again.
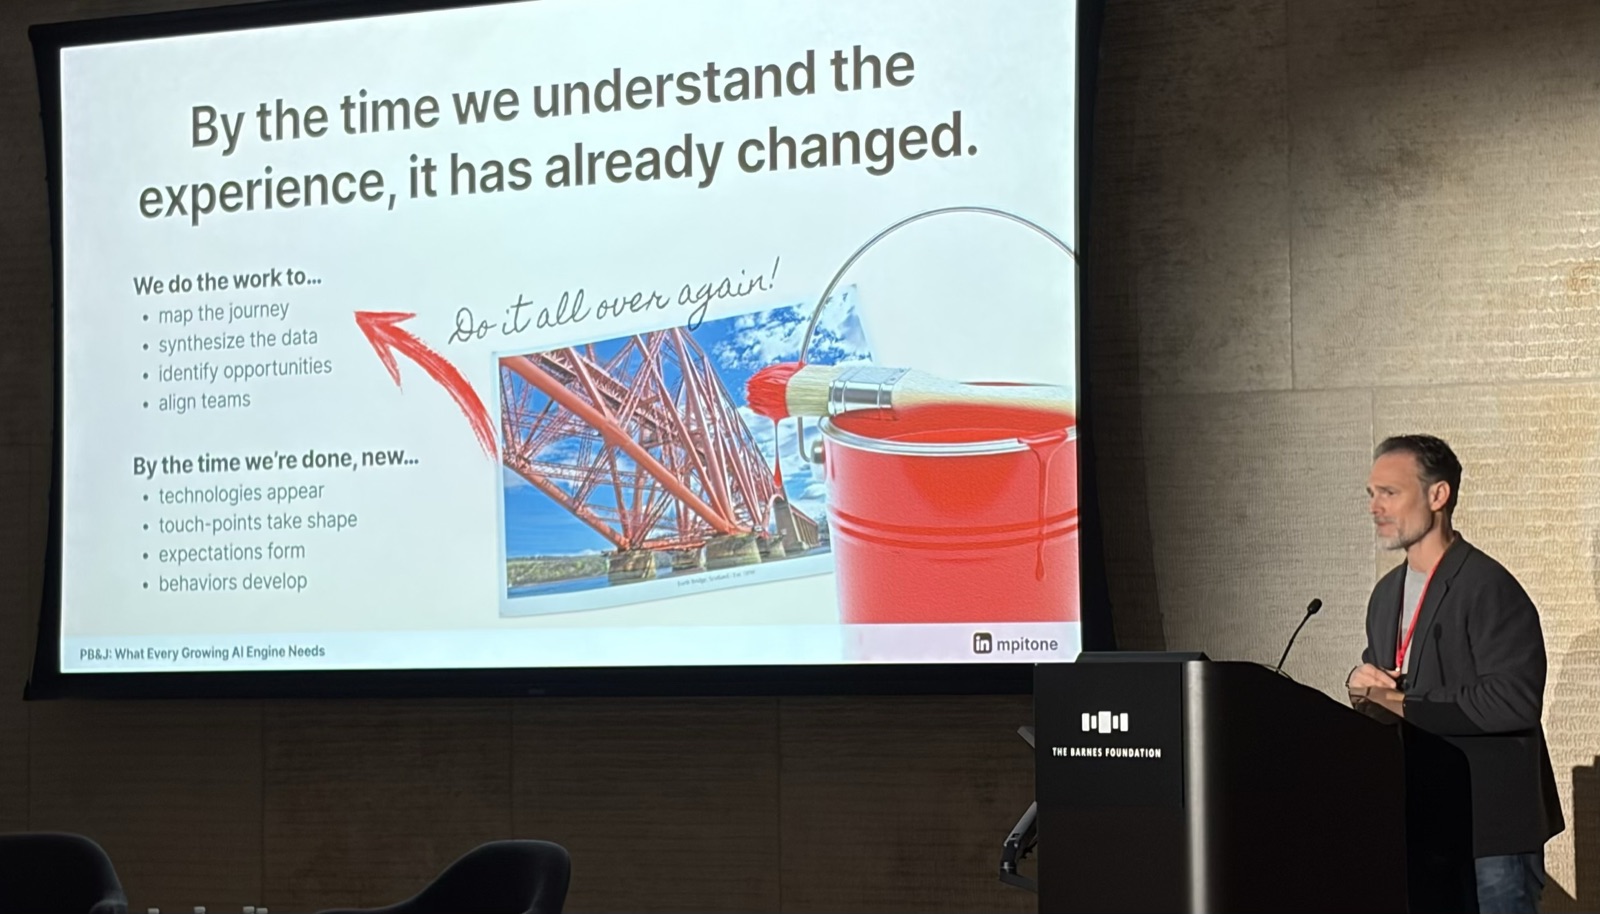
He still thinks journey maps are “incredibly important” (and I totally agree). His concern was that customer behavior now changes faster than we can document it. His own example is that his twenty-year-old daughter and seventeen-year-old son buy things on TikTok without thinking twice.
That was the backdrop for CX 2030, a project to figure out what Wawa needs to be ready for in the next few years: which systems need to mature and where to invest.
Mike’s team decided to build a service blueprint, end to end. It covered the frontline, where customers interact with associates, and the back line, where associates in the kitchen work with the kitchen management system and orders flow back and forth with the point of sale.
Wawa’s journeys have become too complex to map all of them, so the team picked five of their 19 journeys, the ones that mattered most based on where the most revenue comes from and which channels are growing fastest.
Then they ran five internal workshops with 26 participants, from the top to the bottom of the organization, over 12 weeks.
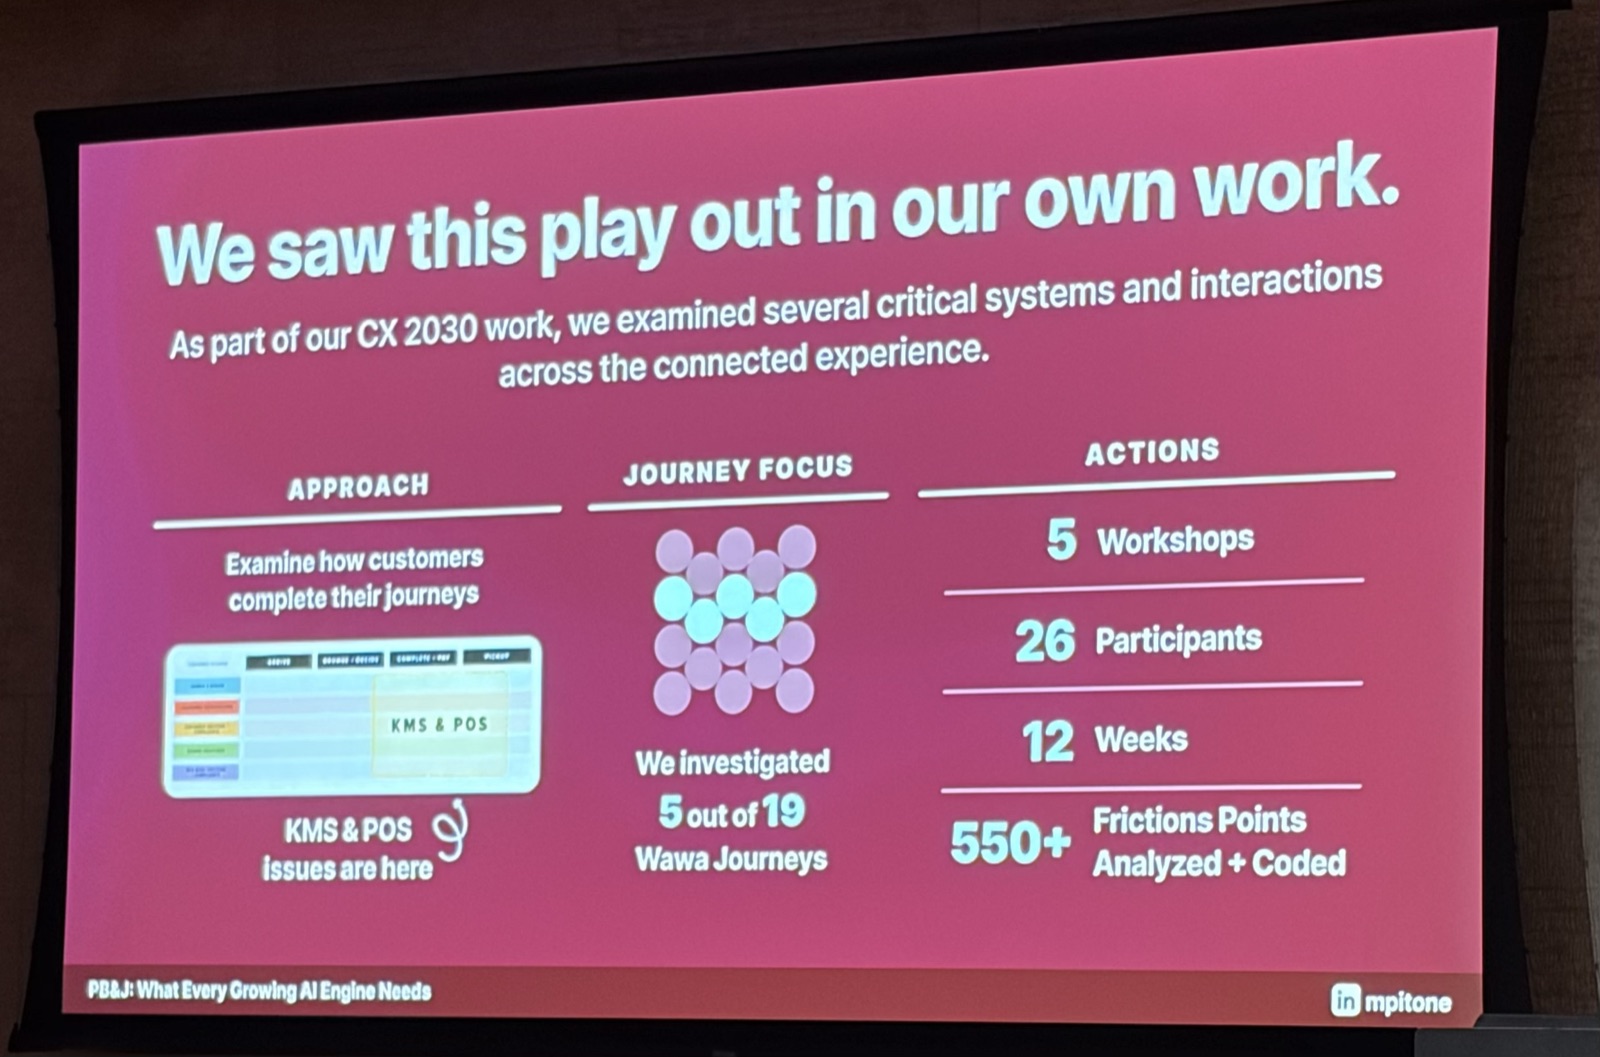
They came out with more than 550 friction points.
Of those, 355 affect customers, 145 affect associates, and 55 affect “Red Roof”, Wawa’s corporate campus. Mike admitted that seeing the lion’s share land on customers was “really nerve-wracking” for someone in charge of customer experience.
A handful were about the physical space, and one of them is the double pickup that every Wawa regular knows: your food is in one place, your drink is in another, and you’re left wondering where your stuff is.
From Friction Points to Stories
A list of 550 friction points tells you where it hurts, but it doesn’t tell you what to do about it. So the team started coding them. Mike borrowed an idea from atomic design : a friction point is the atom, and when you combine atoms you start to see themes.
Themes become needs statements, and since the team is a big fan of Jobs to Be Done , they write those as outcome statements, grounded in something a person is trying to get done.
This is where things got uncomfortable. Wawa had done this kind of research before: an off-premises study in 2022 (ordering digitally and picking up in the store), an on-premises study based on observation and task analysis, and customer segmentation work in 2025 and 2026.
The wording changed from project to project, but the same themes kept coming back:
- Get my order right
- Make it easy for me
- Keep me informed
- Recognize me.
Mike called what they had been doing “isolated repairs.” Each project could only see what was in front of it, because the channels were too complex and the data wasn’t in one place. The team would fix an issue in one channel without realizing that the same issue showed up, slightly different, in other channels and moments.
So they kept tagging.
Which other systems are involved? Where else has this appeared?
Who is affected?
They also coded when each friction point happens: across a whole phase of the journey, at a specific moment, or during a single interaction like scanning or dipping a card. And they folded in what they had learned from the segmentation work.
Here’s what one friction point looks like once it’s coded.
When a self-checkout machine goes down, customers don’t know what to do, and neither do associates.
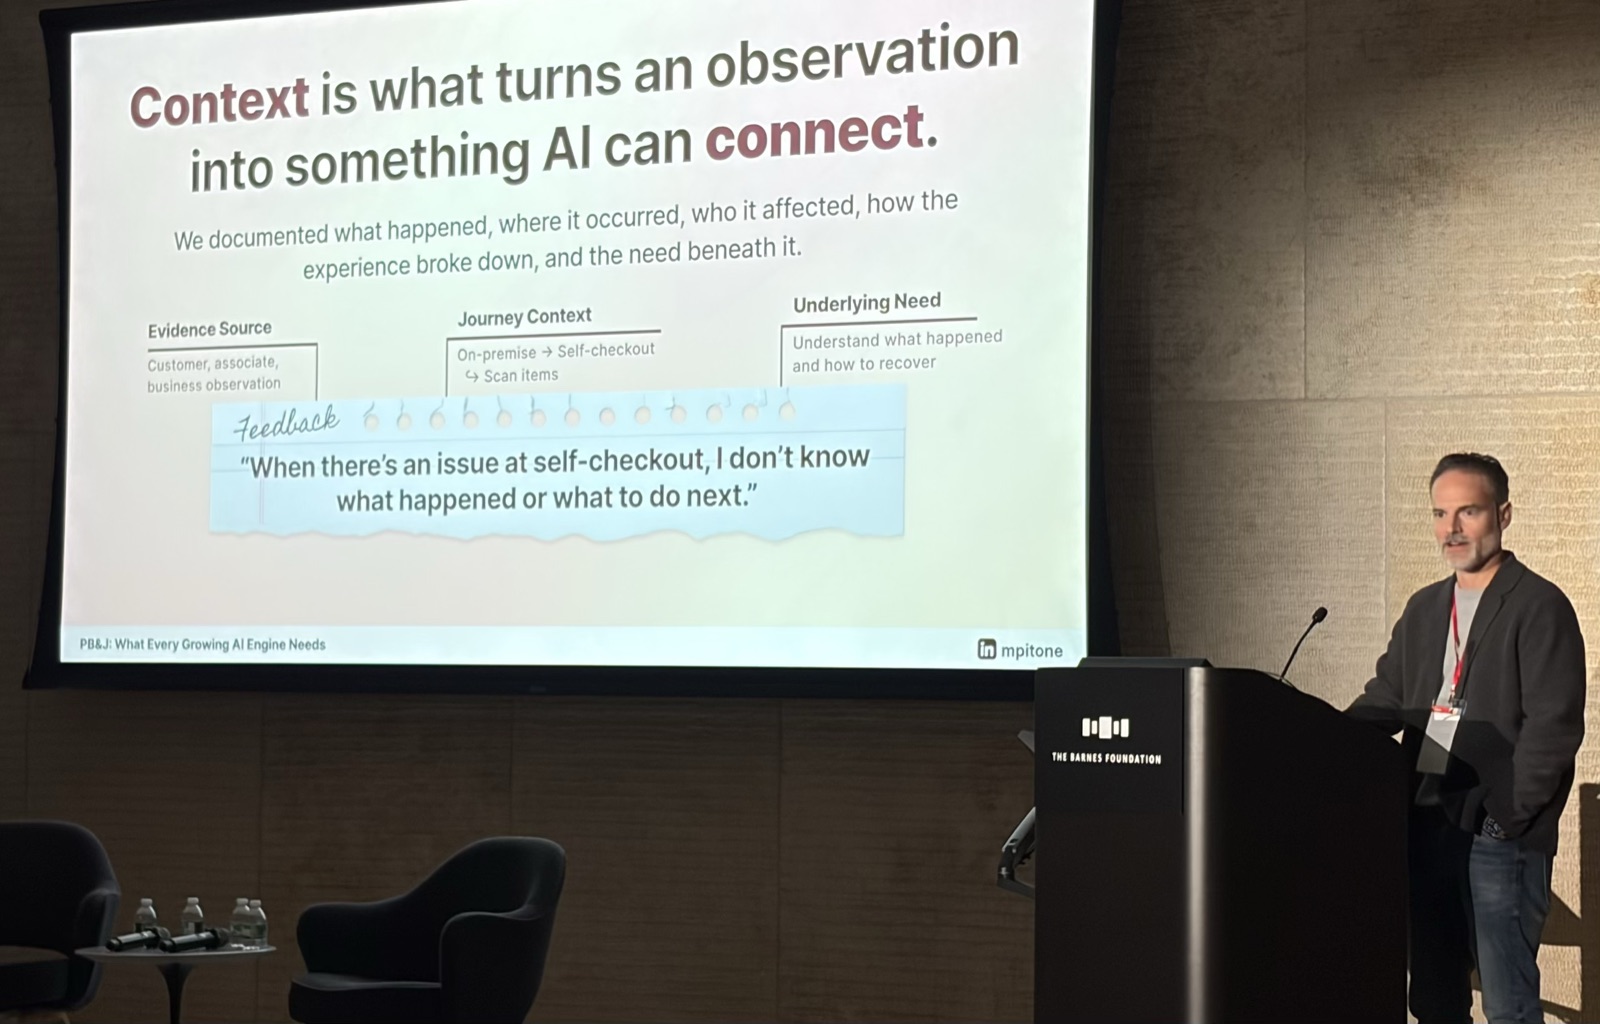
Mike said it reminded him of the early kiosk rollout, when associates told them much the same thing: they didn’t know what to do with it, customers kept asking them for help, and they felt terrible. Coded, it looks like this:
- Evidence source: customer, associate, and business observation
- Context: on-premises, using self-checkout, scanning items
- Underlying need: understand what’s going on so I can recover and move forward
- Business theme: checkout
- Experience breakdown: comprehension
- Who’s affected: customers and associates
The real dataset has many more attributes per friction point, but this gives you the idea.
With enough of these, friction points roll up into needs statements, and needs statements roll up into thematic stories. A single friction point can belong to several different stories.
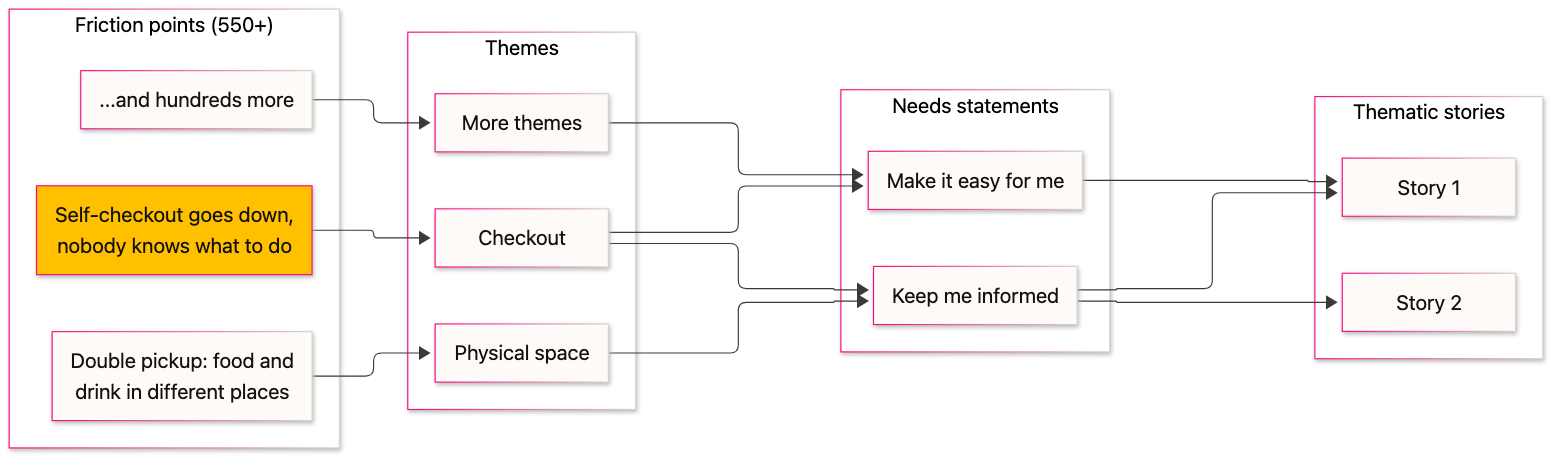
My sketch of the roll-up, using two of the friction points from the talk. The themes, needs, and stories shown are illustrative.
That gave the team something they could take to Wawa’s executives: if we want to fix this story, these are the needs and friction points that go with it. Mike described the shift as going from isolated repairs to “fixing on mission.”
The Peanut Butter and Jelly Problem
This is where the title of the talk comes in. Mike played a cut of a viral video where a second-grade teacher asks her students to write instructions for making a peanut butter and jelly sandwich, and then follows them exactly as written:
Mike’s take was that working with AI is a lot like that. You wouldn’t hand a ten-year-old the car keys and tell them to drive to school, but that’s more or less what we do when we hand a model a vague request.
He said that without all the coding work, he would have been the second grader writing instructions to Copilot or Claude: “I have a friction point and we’re trying to figure out how to fix it.” He’d get back whatever the model thought was best, without enough information to give him anything meaningful, and nobody on the team would be aligned on what to do with it.
In his words, it’s “less about learning prompt design” and “more about just learning to be descriptive with your context.”
What makes this more than a cute analogy is that Wawa now has the ingredients: customer needs they treat as tenets, 550 friction points coded by channel, type, impact, and moment, and their customer segments.
The next step Mike described was going to the data and customer insights teams to connect a segment to real order data, for example to see whether a customer’s behavior looks like a known friction point. He was clear that they’re not rushing it, and he isn’t worried about cleaning up the data first, since another agent could probably help with that: “let’s start practicing on this.”
The Agents They Want to Build
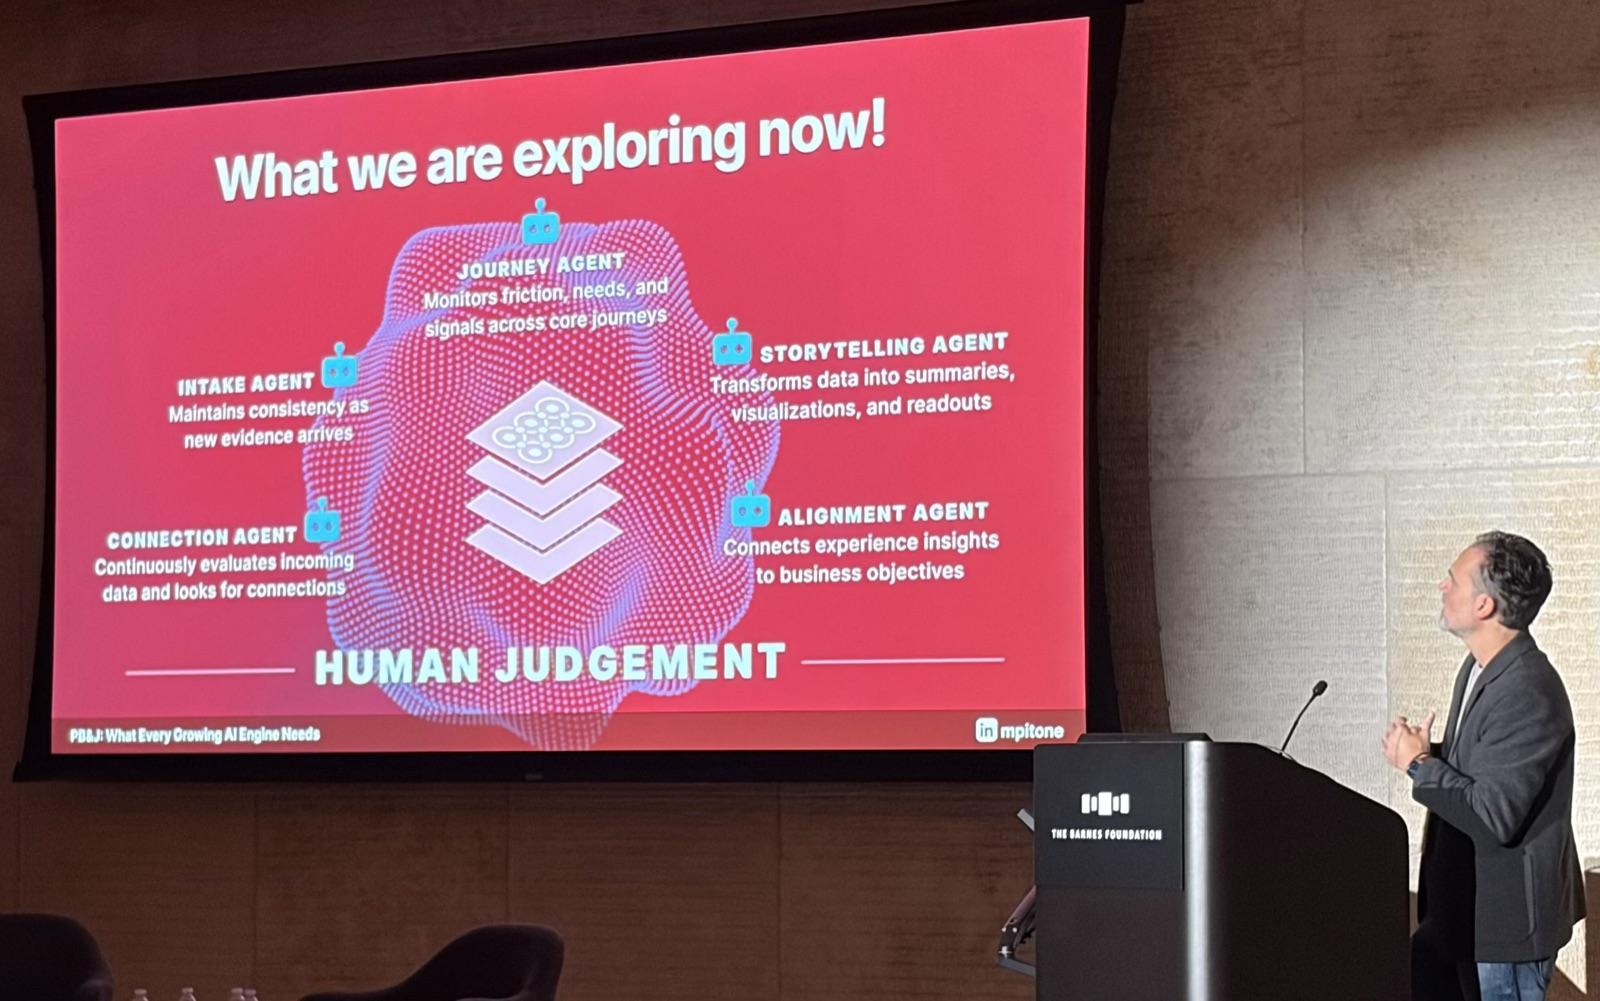
Mike stressed that this isn’t one agent. As an experience team, they’re also thinking about the experience of using this information, and the system he described has several pieces.
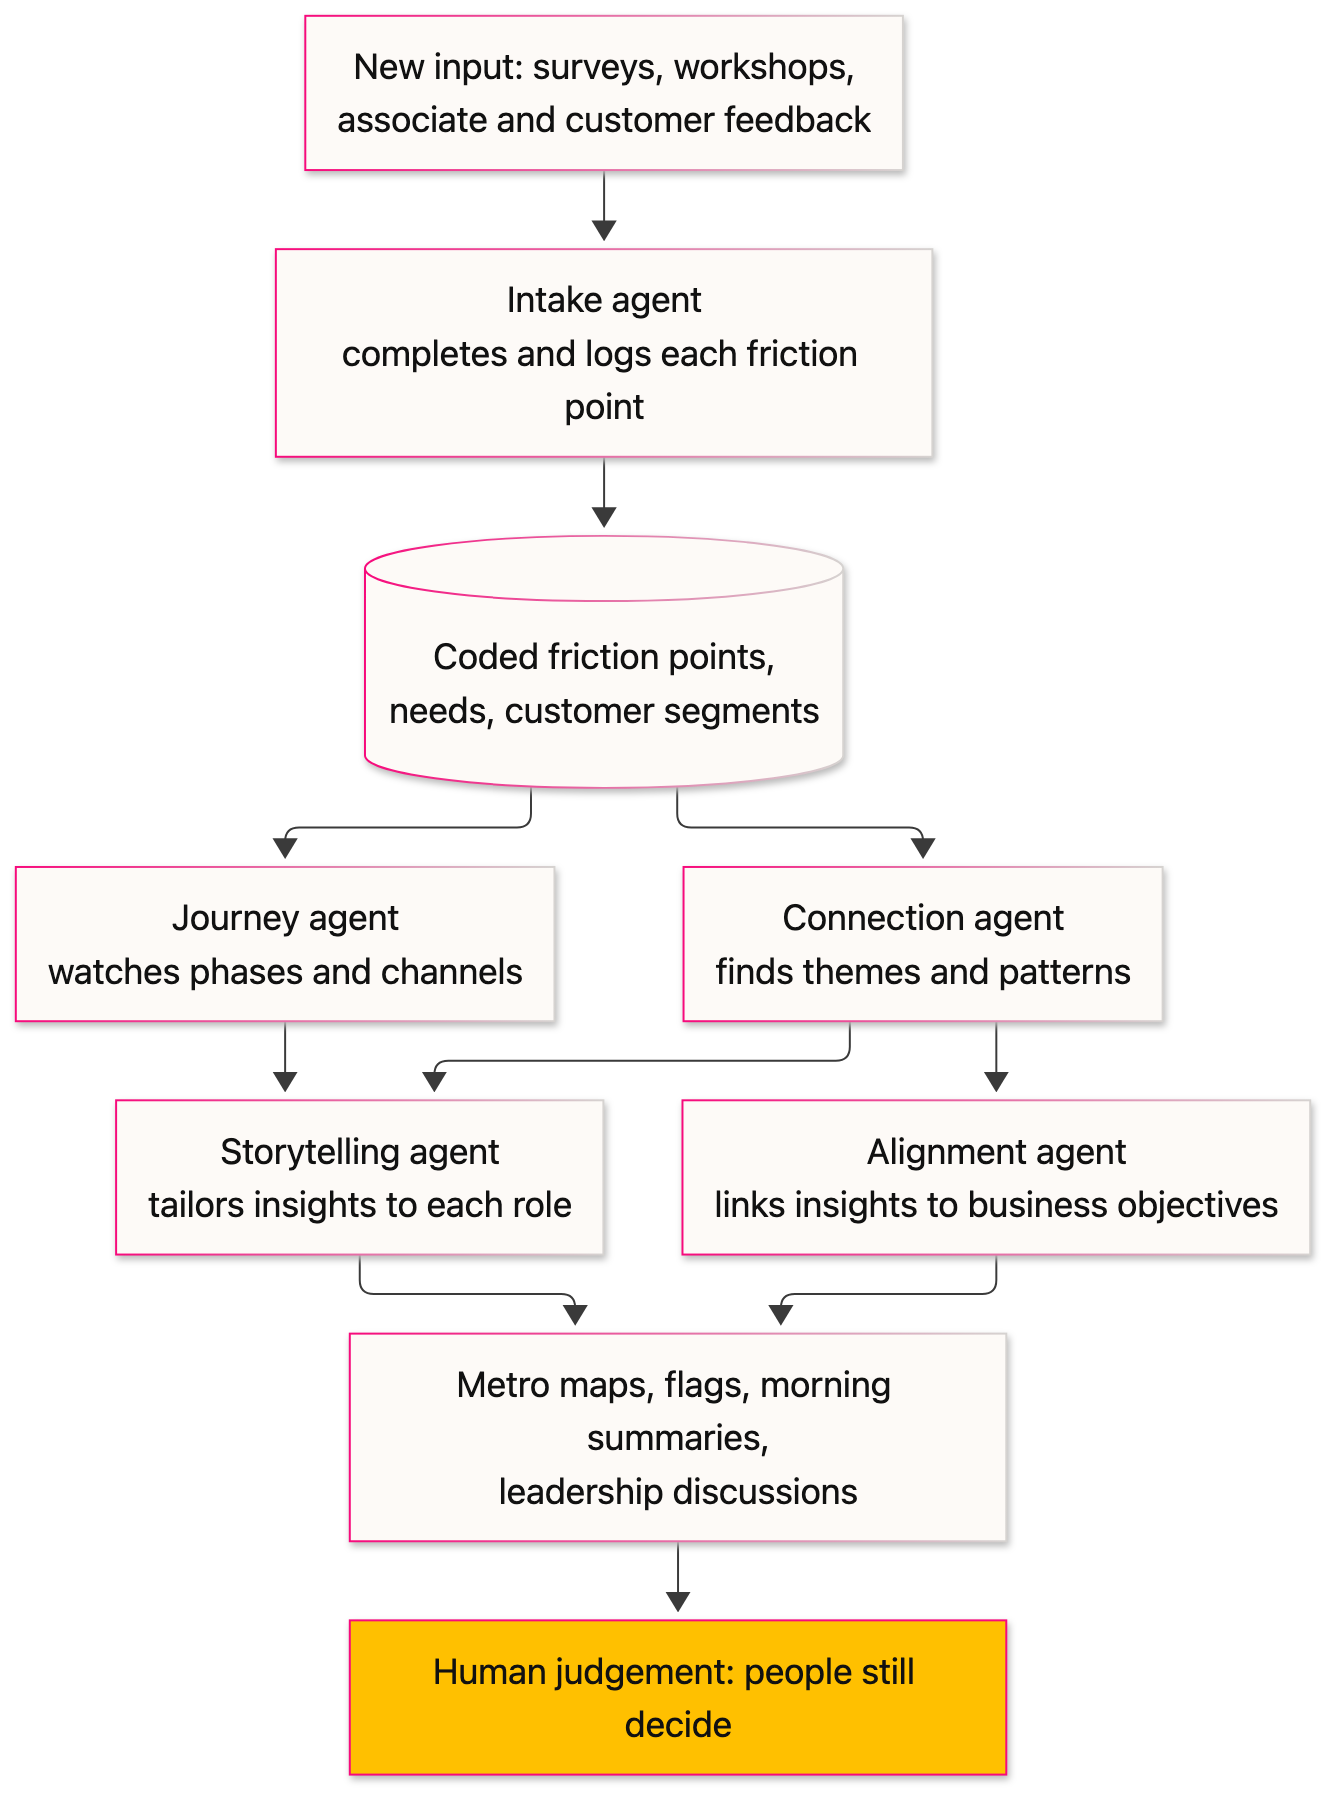
My sketch of how the pieces could fit together. Mike described the roles, not the exact connections.
An intake agent would make sure every new friction point comes in complete, guide people through filling in what’s missing, and get it logged in the right place.
A connection agent would look for themes and patterns “all day long.” A journey agent would watch across phases and channels.
The timing helps. At the time of the talk, Wawa was about to expand its customer survey, which brought in only a small trickle of feedback, and Mike called it opening the faucet.
Because of this project, one of the requirements for the new survey is that feedback arrives with the same attributes they use in their friction finder, no matter where it comes from.
The piece I found most interesting was the storytelling agent. Mike doesn’t want just another dashboard or report.
Different people need the same information in different shapes: an experience architect who owns a core journey needs something different from the product manager who owns the menu or checkout.
He described metro maps that show where customers drop off, flags for where a journey is doing better or worse than expected, and a morning summary for product managers on how their features are performing. He even wants a podcast he can listen to in the car on the way in, covering how customer adoption differs between the regions where Wawa is expanding.
As he put it, he doesn’t want to redo the journey mapping again; the system can do it with him and give him flags. It is the Forth Bridge problem, with the paint crew replaced by an agent.
The bigger goal is alignment, and his slide even has an alignment agent that connects experience insights to business objectives.
Mike imagines leadership in a room with three things: who the customers are, what the company believes, and the key stories of friction and opportunity.
With those three, he thinks they can finally agree on where to focus. At the time of the talk, Wawa had two pilots underway with two different partners, because, in his words, this is “much bigger” than something they want to do on their own.
For a convenience store, the stakes are high. Wawa’s largest segment is one Mike’s team calls the “usability segment”: customers who give you one shot and expect zero friction. He also pointed out that Wawa doesn’t sell anything you can’t get down the road. People come for how it’s done, and associates are telling them it’s getting harder to do their jobs as the channels multiply.
Mike tied all of this to a practical goal: giving time back to associates at Red Roof and in the stores so they can do a better job and, as he put it, still be Wawa.
He mentioned they had just found one of these needles in a haystack for a customer, and that with this system in place they would have found it in a fraction of the time instead of months.
My Take
What I liked most about this talk is that the hardest part of Mike’s project so far had nothing to do with AI.
Twelve weeks of workshops, 550 friction points, and a consistent way of tagging each one: that’s the context. The agents come later, and they’ll only be as good as what the team feeds them.
The good news is that most teams can start on that part today, with or without agents. You don’t need 26 people and a service blueprint to write down the friction your customers and employees run into, and to tag it the same way every time: who’s affected, where it happens, and what need it gets in the way of.
If you ever do point a model at that data, you’ll be giving it real instructions instead of “you get bread, you get peanut butter, and you get jelly.” (We cover the same idea at the prompt level in Prompt Engineering Techniques: Part 1 .)
I also appreciated how Mike talked about decisions. In his words, AI should be the thing that helps them find the connections, “and then we still decide.” He called taking its output at face value one of the greatest risks. His agents slide puts “Human Judgement” underneath all of them.
A storytelling agent that summarizes hundreds of friction points every morning will sometimes be confidently wrong, and the coded data is also what lets your team check its work. Without it, as Mike put it, loose context is going to “make a mess.”
We wrote about the same pattern, where AI proposes and deterministic checks validate, in Case for AI Powered Data Pipelines , and about measuring whether an AI system is right often enough in Traces to Insights: Evaluating LLM Apps .
It’s also worth remembering that Wawa is only a few months into this. As of Mike’s talk, the two pilots were still running and the morning podcast was still an idea. I’d love to hear how it goes.
Conclusion
In this article, I shared how Wawa turned 550+ friction points from a service blueprint into coded context for AI, and why Mike thinks the work is less about prompt design and more about being descriptive. If you’re considering AI agents for your own business, a practical first step is to look at the data you already have and ask whether a model could make sense of it. Structuring that data may well take more time than building the agent, and it’s worth doing either way.
Keep in mind that Wawa is still early in this work, so treat it as a promising approach rather than a proven one. If you’re still deciding whether you need an agent at all, we wrote about when your business needs an AI agent , and what to expect from your AI project walks through what normal uncertainty looks like once you start.
A big thank you to O3 World for organizing the 1682 Conference and bringing together such an inspiring set of speakers from the Philadelphia area. It was exciting to learn from peers in our own community, and I’m already looking forward to the next one.
If you want another perspective from the same day, I also wrote about Guru’s talk at 1682 , which is about the impact of AI in the world of SaaS companies.
Not sure where AI fits in your business? Let’s talk .